STOCK INDICES VIDEO OUTLOOK 2022 Part I/III
SEVERE CORRECTION in 2022
Post-Pandemic Advance Set to Take a Pause within Final Stage of Secular-Bull Uptrend – Risk of minus -30 to -40% Correction in Benchmark Indices during next 6-8 Months – Inflationary Pressures Ease but Not Over – European Indices set for Significant Correction – Technology/FANGS+ Undergo Severe Sell-Off in 2022 – Secular-Bull Uptrend Peak On-Track for 2023-24
Stock Indices Video Update
The post-pandemic advances from the March ’20 lows are reaching interim peaks in their overall development within the final stages of the secular-bull uptrend. These interim uptrends have in many cases, already ended into November’s highs. However, there are other indices/sectors that can stretch to higher-highs during the next month, into early new year, 2022. This largely depends on asset allocation and rotation, but any higher-highs are likely to be short-lived.
A repeat of 2020’s sell-off from the January/February peaks are expected this year, in 2022. Furthermore, declines in U.S./European indices are expected to undergo corrections of between minus -30% to -40% per cent. This is more limited in many Emerging Market indices and especially China where declines are relatively modest by comparison.
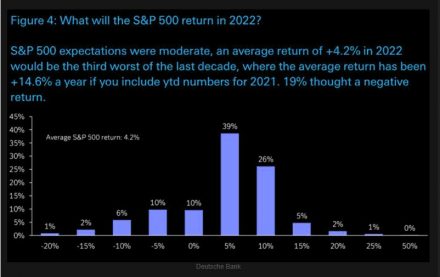
Fig #1 – What will the SP500 return in 2022? Source: Deutsche Bank
Deutsche Bank conducted a survey to its clients, asking what expected return for the SP500 is forecast for 2022 – see fig #1. The result predominantly shows most, 39% expects a positive return for next year at +5% per cent – 26% expects a gain of +10% per cent and 5% per cent expects a gain of 15% per cent. Contrastingly, 26% expect declines of between 0.0% or max. -10% per cent.
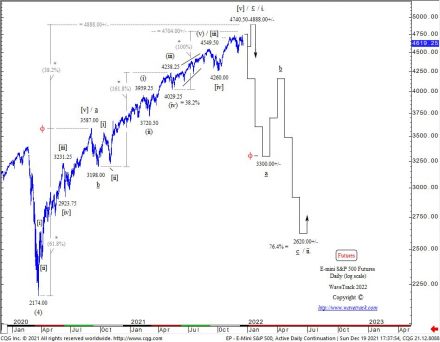
Fig #2 – E-Mini SP500 Futures – Daily by WaveTrack International
The predominant bullish calls are what we’d expect near the top of a stock market uptrend. Mainly, from a contrarian standpoint, it heightens the probability of a correction next year. However, it also shows the current complacency in the market – no one is expecting a correction of between minus -30% to max. -40% as Elliott Wave analysis predicts – see fig #2.
Inflation
Rising inflationary pressures have dominated financial markets during 2021 and this is expected to continue during the first month or two into the new year, 2022. The headline U.S. Consumer Price Index has surged higher to 6.8% in November with Food rising by 6.1% year-on-year whilst Energy has risen by 33.3% per cent. However, all these are expected to stage an interim peak during the next month or two, then beginning corrective declines. Rising inflationary pressures don’t resume higher until Q3/Q4 2022.
Annual 2022 Forecasts – Report/Video
Our annual 2022 Stock Indices report/video is PART I of a three-part trilogy series of Elliott Wave analysis, an outlook for the next year and into the final stages of the secular-bull ‘Inflation-Pop’ cycle.
We’ll be taking a close introspective look across many U.S. indices, the large-cap and small-cap trends. But also across many different sectors too including the FANGS+ index, U.S./European Banks, Biotechnology, Technology and many more. We’re also updating some fascinating Elliott Wave counts for several economic data points too, including Consumer Sentiment, Consumer Confidence, Price to Book Ratio, Price-Sales Ratio! There’s some interesting results from the recent upsurge in inflationary pressures too!
New Stock Indices 2022 Video – PART I/III
This ANNUAL 2022 VIDEO UPDATE for STOCK INDICES is like nothing you’ve seen anywhere else in the world. It’s unique to WaveTrack International, how we foresee trends developing through the lens of Elliott Wave Principle (EWP) and how its forecasts correlate with Cycles, Sentiment extremes and Economic data trends.
We invite you to take this next step in our financial journey with us – video subscription details are below – just follow the links and we’ll see you soon!
Most sincerely,
Peter Goodburn
Founder and Chief Elliott Wave Analyst
WaveTrack International
Contents Stock Indices Video Outlook 2022
Charts: 98 | Video: 2 hours 40 mins.
CONTACT US NOW VIA EMAIL – SELECT YOUR PACKAGE
Single Video – *$48.00 – PART I Stock Index Video Outlook 2022 (December ’21) or send us an email to services@wavetrack.com
Triple Package offer – *$96.00 (saving 33%)! – PART I – PART II – PART III (January – March ’22)
*(additional VAT may be added depending on your country – currently US, Canada, Asia have no added VAT but most European countries do)
PARTS II & III will be available in a few weeks’ time – we’re working on it!
HOW CAN YOU RECEIVE THE VIDEO FORECAST?
To receive your VIDEO UPDATE please click here to contact us.
– Please state if you wish to purchase the SINGLE VIDEO – Stock Index Video Outlook 2022 for USD *48.00 and send us an email to services@wavetrack.com?
– Or opt for the TRIPLE PACKAGE for USD *96.00 in total?
– Next we will send you a PayPal payment request and provide you with the video link & PDF report once payment is confirmed. Please know the reply can take up to 6 hours. But rest assured we will give our best to provide you with the information as soon as possible!
*(additional VAT may be added depending on your country of residence. Currently, the US, Canada, Asia have no added VAT but most European countries do)
We’re sure you’ll reap the benefits – don’t forget to contact us with any Elliott Wave questions – Peter is always keen to hear your views, queries, and comments.
Visit us @ www.wavetrack.com
The post STOCK INDICES VIDEO OUTLOOK 2022 Part I appeared first on WaveTrack International.


